

Let's learn how to get data from PDFs using Power BI. I'll be using data from WHO relating to worldwide coronavirus cases.
I want to start out by saying that by far the most intriguing thing I discovered is that a country's density does not seem positively correlated with the amount of cases per capita.

Density below 1000 people per km squared seems to have a negative correlation with the amount of cases. This would suggest that countries that have a less dense population are spreading the virus more.
Density above 1000 people per km squared seems to have a positive correlation with the amount of cases, although, there aren't many countries in that sample bucket.

Getting Data From PDFs
Normally, you can simply use the PDF connector that Power BI has built into the UI.

And from there you would just choose the PDF file. However, my PDF is on the web, so I need to go through the web connector first.
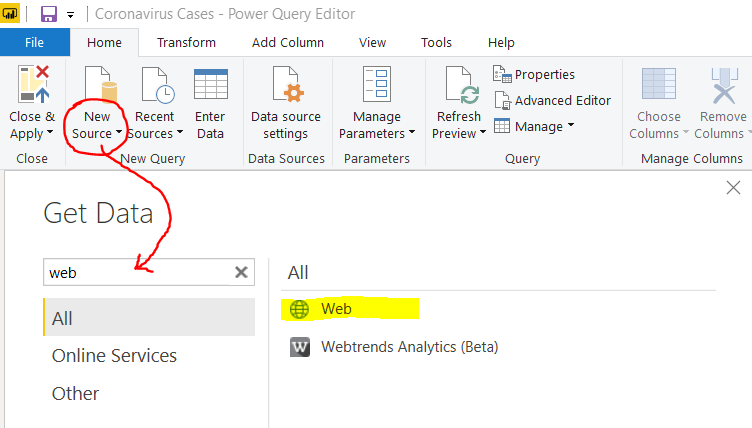
Because the URL I'm using is returning a PDF, Power BI automagically gives us the PDF contents. If you are wondering what the M code is, here it is:
let
    url =
        "https://www.who.int/docs/default-source/coronavirus/
        situation-reports/20200714
        -covid-19-sitrep-176.pdf",
    myWebContents = Web.Contents(url),
    myPDF = Pdf.Tables(myWebContents)
in
    myPDF
Extracting Data From PDFs
The next part was a bit tricky....
Problem:
"How can I point to a value within a table where the ID isn't consistent?"
The table that I need is split over several pages and the name of it isn't consistent either. For example, in the below snippet, the table I need is ID "Table003". This ID changes depending on which report date you are looking at.

This is a problem (especially if you are going to be using this method for multiple PDFs) because if you click to expand the Table003 table, Power Query will store a hard coded reference to that ID.

Solution:
To remedy the situation, we need to create "hooks" for Power Query to grab onto, and pull its way to the correct table.
1. Filter to show only Tables.
2. Add a helper column - column count. I knew the table I needed only had 7 columns.
Table.ColumnCount()
3. Filter on the helper column where column count equals 7. Doing this filters down the tables to the one single table that I need.

From there, you just need to click the Table to extract the data.

Sources
Coronavirus Cases: https://www.who.int
Global Populations: https://www.worldometers.info/world-population/population-by-country/
If you are looking to improve your DAX skills, I would recommend Supercharge Power BI by Matt Allington:


Comments